
Modern observability tooling makes big promises. Deploy your .NET services into Azure App Services, tick the right boxes, and the platform conveniently hands you metrics, logs, and traces. Azure Monitor, Application Insights, Log Analytics – they all integrate neatly as long as you never leave the hyperscaler's garden.
Move outside that comfort zone and things become less magical. Some organizations run on-prem hardware. Others prioritize cost efficiency. Some want vendor neutrality. And some simply don't want a telemetry bill that spikes every time their application starts behaving correctly (or incorrectly).
The good news: the open-source ecosystem has matured to the point where you can build a full, cloud-ready observability pipeline without surrendering half your operating margin. This post walks through the architecture I'm currently running for production-grade monitoring of .NET/Go & other services using Alloy, Loki, Tempo, Mimir & Grafana, with Caddy in front as the secure ingestion layer and Faro providing full browser-side observability.
Only open-source components. Fully interoperable with OpenTelemetry. Low operational overhead. No vendor lock-in.
Architecture Overview
The design goal is straightforward: a single ingestion gateway for all telemetry—backend, frontend, containers, infrastructure—flowing into specialized downstream systems optimized for their respective data types.
Signal flow:
Traces:
Application → OTLP → Alloy → Tempo → Grafana
Metrics:
Application → OTLP → Alloy → Prometheus remote_write → Mimir → Grafana
Docker metrics → cAdvisor → Alloy → Prometheus → Mimir
Logs:
Application → OTLP → Alloy → Loki
Docker logs → Alloy → Loki
Faro Web SDK → Alloy → Loki → Grafana
All ingestion from public networks is terminated by Caddy, which exposes HTTPS endpoints and authentication where necessary. Alloy stays internal, which keeps the attack surface tight.
The result is full-stack observability: backend traces + metrics + logs, frontend vitals + performance events, container-level signals, and infrastructure metrics—everything correlated into one Grafana interface.
Instrumenting a .NET Application with OpenTelemetry
The .NET side is intentionally simple. OpenTelemetry SDKs do the heavy lifting; your app just needs to define a resource identity and export via OTLP/HTTP to Alloy.
I've enable it with two extension methods:
builder.Host.UseSerilogObservability();
builder.Services.AddObservability("my-app-name", builder.Configuration);
Under the hood, this configures:
- Trace instrumentation (ASP.NET Core, HTTP client, SQL client, EF Core)
- Metrics instrumentation (runtime, ASP.NET Core, HTTP client, custom meters)
- Serilog → OTLP log forwarding
- Resource attributes (service.name, version, instance)
- OTLP HTTP exporters for traces, metrics, logs
Here's the full implementation:
using System.Reflection;
using OpenTelemetry.Exporter;
using OpenTelemetry.Metrics;
using OpenTelemetry.Resources;
using OpenTelemetry.Trace;
using OracleReports.Services.Workers;
using Serilog;
using Serilog.Events;
using Serilog.Sinks.OpenTelemetry;

namespace OracleReports.Services;

public static class ServiceCollectionExtensions
{
    public static IServiceCollection AddObservability(
        this IServiceCollection services,
        string serviceName,
        IConfiguration config)
    {
        var otlpEndpoint = config["OpenTelemetry:Endpoint"] ?? "https://otel.example.com";

        services.AddOpenTelemetry()
            .ConfigureResource(r =>
            {
                r.AddService(serviceName,
                    serviceVersion: Assembly.GetExecutingAssembly()
                        .GetName().Version?.ToString(),
                    serviceInstanceId: Environment.MachineName);
            })
            .WithMetrics(metrics =>
            {
                metrics
                    .AddAspNetCoreInstrumentation()
                    .AddRuntimeInstrumentation()
                    .AddHttpClientInstrumentation()
                    .AddMeter(nameof(DataUpdater))
                    .AddPrometheusExporter()
                    .AddOtlpExporter(o =>
                    {
                        o.Endpoint = new Uri($"{otlpEndpoint}/v1/metrics");
                        o.Protocol = OtlpExportProtocol.HttpProtobuf;
                    });
            })
            .WithTracing(tracing =>
            {
                tracing
                    .AddAspNetCoreInstrumentation()
                    .AddHttpClientInstrumentation()
                    .AddSqlClientInstrumentation(opt =>
                        opt.RecordException = true)
                    .AddEntityFrameworkCoreInstrumentation(opt =>
                    {
                        opt.EnrichWithIDbCommand = (activity, cmd) =>
                        {
                            activity.SetTag("db.command.timeout",
                                cmd.CommandTimeout);
                        };
                    })
                    .AddSource(serviceName)
                    .AddOtlpExporter(o =>
                    {
                        o.Endpoint = new Uri($"{otlpEndpoint}/v1/traces");
                        o.Protocol = OtlpExportProtocol.HttpProtobuf;
                    });
            });

        return services;
    }

    public static IHostBuilder UseSerilogObservability(
        this IHostBuilder hostBuilder)
    {
        hostBuilder.UseSerilog((context, services, logger) =>
        {
            var otlpEndpoint = context.Configuration["OpenTelemetry:Endpoint"]
                ?? "https://otel.example.com";

            logger.MinimumLevel.Information()
                .MinimumLevel.Override(
                    "Microsoft.EntityFrameworkCore.Database.Command",
                    LogEventLevel.Warning)
                .MinimumLevel.Override(
                    "Microsoft.Hosting.Lifetime",
                    LogEventLevel.Warning)
                .MinimumLevel.Override(
                    "Microsoft.AspNetCore.Mvc",
                    LogEventLevel.Warning)
                .MinimumLevel.Override(
                    "Microsoft.AspNetCore.Hosting.Diagnostics",
                    LogEventLevel.Warning)
                .Enrich.FromLogContext()
                .WriteTo.Console(
                    outputTemplate: "[{Timestamp:HH:mm:ss} {Level:u3}] " +
                    "[{SourceContext}] {Message:lj}{NewLine}{Exception}")
                .WriteTo.OpenTelemetry(
                    endpoint: $"{otlpEndpoint}/v1/logs",
                    protocol: OtlpProtocol.HttpProtobuf,
                    resourceAttributes: new Dictionary<string, object>
                    {
                        ["service.name"] = context.HostingEnvironment.ApplicationName,
                        ["service.instance.id"] = Environment.MachineName
                    });
        });

        return hostBuilder;
    }
}
At this point the app is emitting high-quality telemetry. The next move is building the backend to receive it.
Grafana Alloy
The Telemetry Gateway
Alloy replaces the classic OpenTelemetry Collector. It's easier to run, more modular, and integrates directly with Grafana stack components.
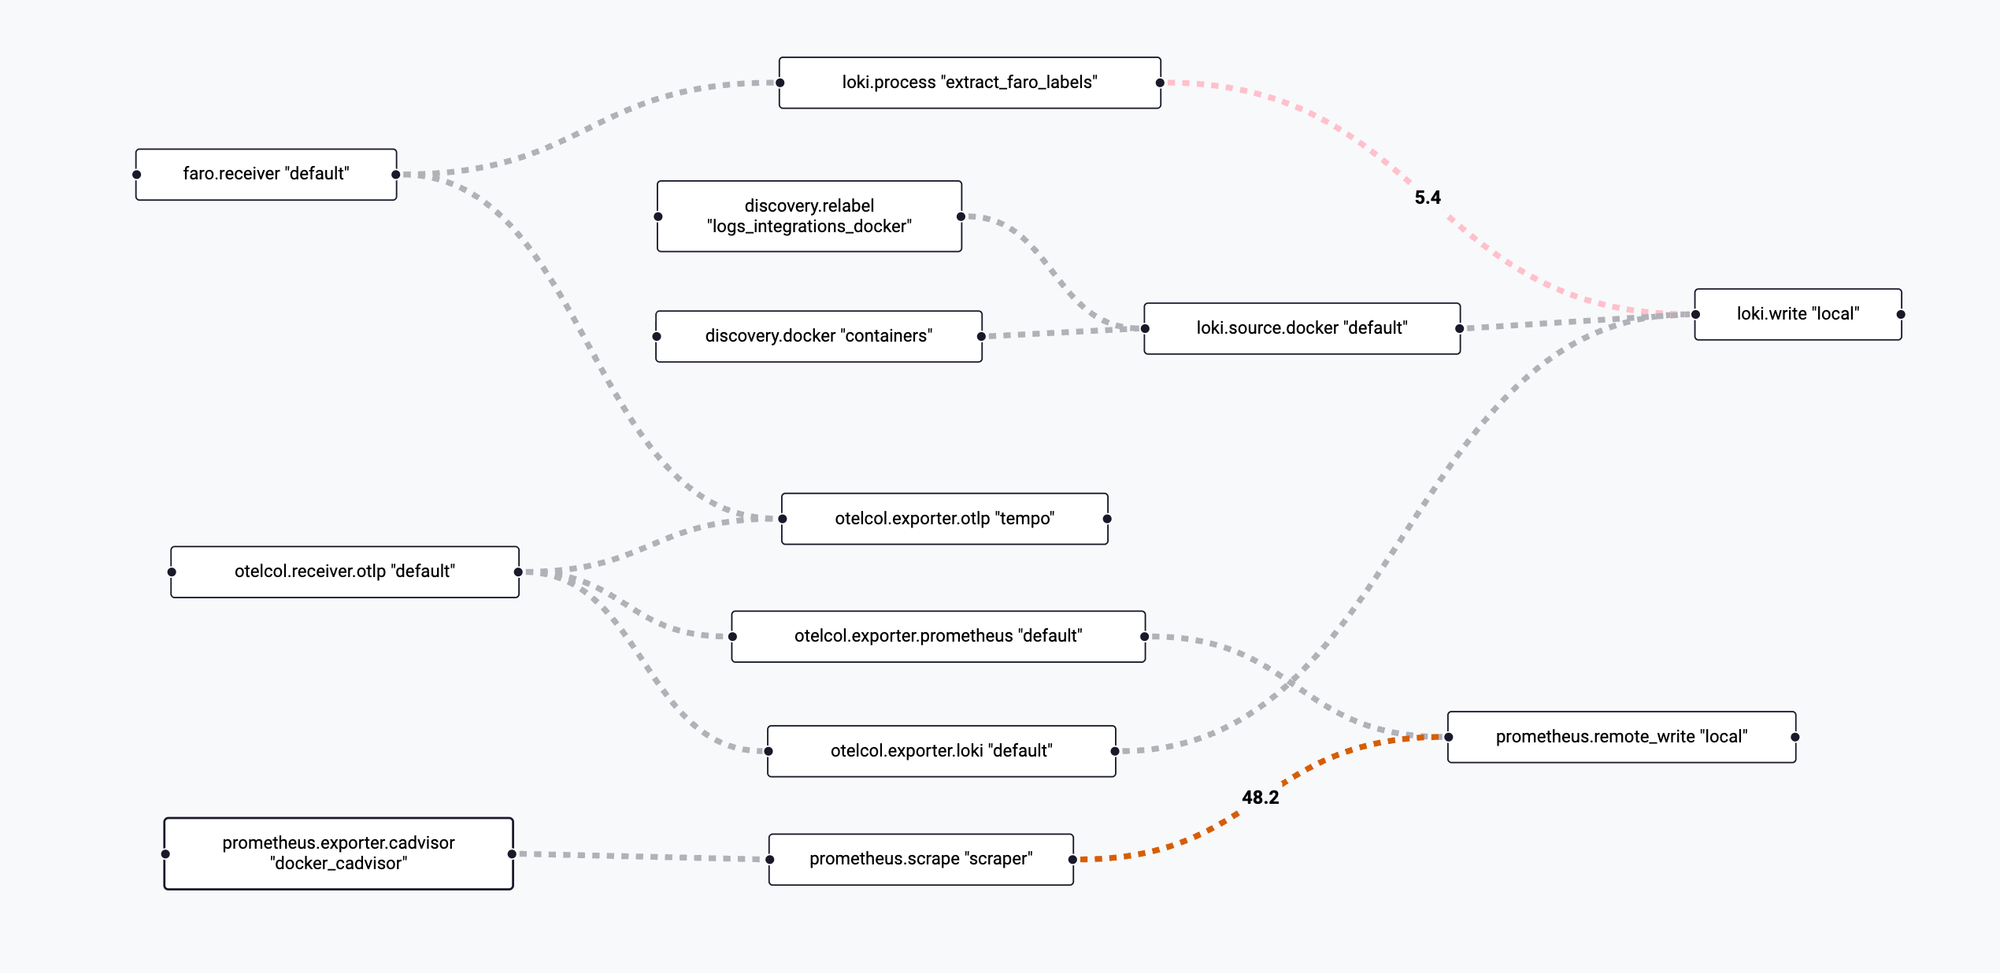
The configuration consolidates:
- OTLP receiver (traces, metrics, logs)
- Loki exporter for log aggregation
- Prometheus remote_write for metrics
- Tempo exporter for distributed tracing
- Docker log source with container discovery
- Faro web telemetry receiver
- cAdvisor for container metrics
- Metadata relabeling and extraction
logging {
  level = "info"
  format = "logfmt"
}

# OpenTelemetry receiver (we will expose this with Caddy using HTTPS)
otelcol.receiver.otlp "default" {
  http {
    endpoint = "0.0.0.0:4318"
  }

  output {
    traces = [otelcol.exporter.otlp.tempo.input]
    metrics = [otelcol.exporter.prometheus.default.input]
    logs = [otelcol.exporter.loki.default.input]
  }
}

otelcol.exporter.loki "default" {
  forward_to = [loki.write.local.receiver]
}

otelcol.exporter.prometheus "default" {
  forward_to = [prometheus.remote_write.local.receiver]
}

prometheus.exporter.cadvisor "docker_cadvisor" {
  docker_host = "unix:///var/run/docker.sock"
  storage_duration = "5m"
}

prometheus.scrape "scraper" {
  targets    = prometheus.exporter.cadvisor.docker_cadvisor.targets
  forward_to = [prometheus.remote_write.local.receiver]
  scrape_interval = "10s"
}

prometheus.remote_write "local" {
  endpoint {
    url = "http://prometheus:9090/api/v1/write"
  }
}

discovery.docker "containers" {
  host = "unix:///var/run/docker.sock"
}

discovery.relabel "logs_integrations_docker" {
  targets = []

  rule {
    source_labels = ["__meta_docker_container_name"]
    regex = "/(.*)"
    target_label = "service_name"
  }
}

loki.source.docker "default" {
  host       = "unix:///var/run/docker.sock"
  targets    = discovery.docker.containers.targets
  labels     = {"platform" = "docker"}
  relabel_rules = discovery.relabel.logs_integrations_docker.rules
  forward_to = [loki.write.local.receiver]
}

loki.write "local" {
  endpoint {
    url = "http://loki:3100/loki/api/v1/push"
  }
}

otelcol.exporter.otlp "tempo" {
  client {
    endpoint = "tempo:4317"
    tls {
      insecure = true
    }
  }
}

faro.receiver "default" {
  server {
    listen_address = "0.0.0.0"
    listen_port = 12347
  }

  output {
    logs = [loki.process.extract_faro_labels.receiver]
    traces = [otelcol.exporter.otlp.tempo.input]
  }
}

loki.process "extract_faro_labels" {
  stage.logfmt {
    mapping = {
      app_name = "app_name"
      app_version = "app_version"
      sdk_version = "sdk_version"
      session_id = "session_id"
      kind = "kind"
      event_name = "event_name"
      event_domain = "event_domain"
      type = "type"
      browser_name = "browser_name"
      browser_version = "browser_version"
      browser_os = "browser_os"
      browser_mobile = "browser_mobile"
      browser_language = "browser_language"
      browser_viewportWidth = "browser_viewportWidth"
      browser_viewportHeight = "browser_viewportHeight"
      browser_userAgent = "browser_userAgent"
      page_url = "page_url"
      event_data_name = "event_data_name"
      event_data_duration = "event_data_duration"
      event_data_responseStatus = "event_data_responseStatus"
      cls = "cls"
      fcp = "fcp"
      fid = "fid"
      inp = "inp"
      lcp = "lcp"
      ttfb = "ttfb"
      context_rating = "context_rating"
    }
  }

  stage.labels {
    values = {
      app_name = "app_name"
      app_version = "app_version"
      kind = "kind"
      event_name = "event_name"
      browser_name = "browser_name"
      browser_os = "browser_os"
      context_rating = "context_rating"
    }
  }

  stage.structured_metadata {
    values = {
      session_id = "session_id"
      page_url = "page_url"
      event_data_name = "event_data_name"
      browser_version = "browser_version"
      cls = "cls"
      fcp = "fcp"
      fid = "fid"
      inp = "inp"
      lcp = "lcp"
      ttfb = "ttfb"
    }
  }

  forward_to = [loki.write.local.receiver]
}
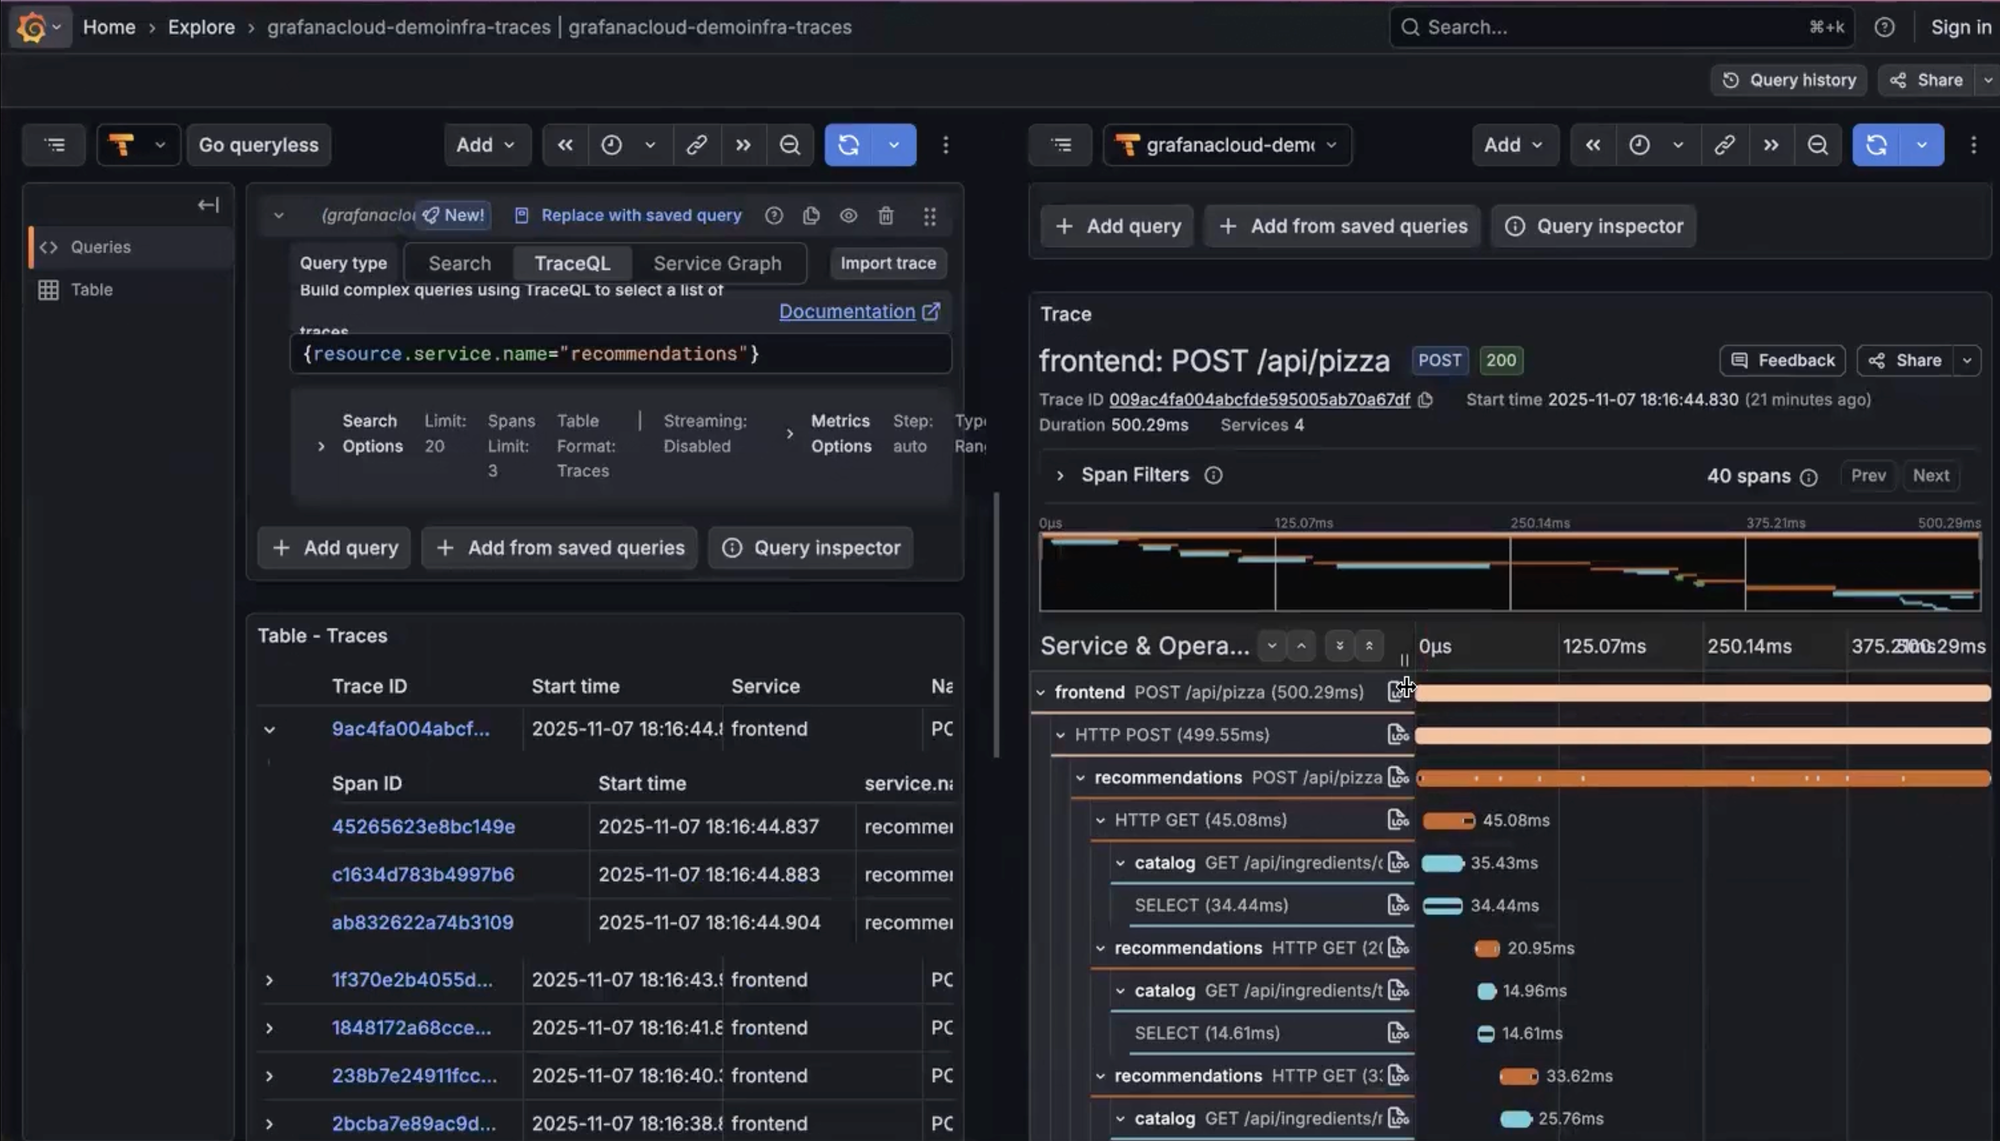
Tempo
Distributed Tracing Backend
Tempo stores traces cheaply and scales horizontally without needing a traditional database. The configuration enables:
- OTLP ingestion over gRPC
- Search API with configurable SLOs
- Metrics generation (service graphs + span metrics)
- Local storage with S3 compatibility for production
stream_over_http_enabled: true
server:
  http_listen_port: 3200
  log_level: info

query_frontend:
  search:
    duration_slo: 5s
    throughput_bytes_slo: 1.073741824e+09
    metadata_slo:
      duration_slo: 5s
      throughput_bytes_slo: 1.073741824e+09
  trace_by_id:
    duration_slo: 5s

distributor:
  receivers:
    otlp:
      protocols:
        grpc:
          endpoint: "0.0.0.0:4317"

ingester:
  max_block_duration: 5m

compactor:
  compaction:
    block_retention: 1h

metrics_generator:
  registry:
    external_labels:
      source: tempo
      cluster: docker-compose
  storage:
    path: /var/tempo/generator/wal
    remote_write:
      - url: http://prometheus:9090/api/v1/write
        send_exemplars: true
  traces_storage:
    path: /var/tempo/generator/traces

storage:
  trace:
    backend: local
    wal:
      path: /var/tempo/wal
    local:
      path: /var/tempo/blocks

overrides:
  defaults:
    metrics_generator:
      processors: [service-graphs, span-metrics, local-blocks]
      generate_native_histograms: both
Loki – Log Aggregation with Object Storage
Loki stays efficient because it indexes only labels, not log content. The configuration:
- Enables TSDB mode for better performance
- Ships indexes and chunks to S3-compatible object storage (Hetzner in my case)
- Defines a compactor for long-term retention optimization
- Supports ingestion from Alloy and Caddy-exposed endpoints
auth_enabled: false

server:
  http_listen_port: 3100

common:
  instance_addr: 127.0.0.1
  path_prefix: /loki
  storage:
    filesystem:
      chunks_directory: /loki/chunks
      rules_directory: /loki/rules
  replication_factor: 1
  ring:
    kvstore:
      store: inmemory

schema_config:
  configs:
    - from: 2020-10-24
      store: tsdb
      object_store: s3
      schema: v13
      index:
        prefix: index_
        period: 24h

storage_config:
  tsdb_shipper:
    active_index_directory: /loki/tsdb-shipper-active
    cache_location: /loki/tsdb-shipper-cache
  aws:
    bucketnames: logs-bucket-name
    endpoint: https://nbg1.your-objectstorage.com
    region: nbg1
    s3forcepathstyle: true
    insecure: false

compactor:
  working_directory: /loki/compactor

ruler:
  alertmanager_url: http://localhost:9093
Mimir – Horizontally Scalable Metrics Backend
Prometheus is excellent for scraping, but not designed for long-term storage or scale-out. Mimir fills that gap with a distributed architecture.
The deployment uses:
- Three-node Mimir cluster with memberlist gossip protocol
- Nginx load balancer for request distribution
- S3-compatible storage (Hetzner Object Storage)
- Integrated Alertmanager
Mimir configuration:
target: all,alertmanager,overrides-exporter

common:
  storage:
    backend: s3
    s3:
      endpoint: nbg1.your-objectstorage.com
      access_key_id: YOUR_ACCESS_KEY
      secret_access_key: YOUR_SECRET_KEY
      bucket_name: YOUR_LOGS_BUCKET_NAME

blocks_storage:
  storage_prefix: blocks
  tsdb:
    dir: /data/ingester

memberlist:
  join_members: [mimir-1, mimir-2, mimir-3]

ruler:
  rule_path: /data/ruler
  alertmanager_url: http://127.0.0.1:8080/alertmanager
  ring:
    heartbeat_period: 2s
    heartbeat_timeout: 10s

alertmanager:
  data_dir: /data/alertmanager
  fallback_config_file: /etc/alertmanager-fallback-config.yaml
  external_url: http://localhost:9009/alertmanager

server:
  log_level: warn
Nginx load balancer:
events {
    worker_connections 1024;
}

http {
    upstream backend {
        server mimir-1:8080 max_fails=1 fail_timeout=1s;
        server mimir-2:8080 max_fails=1 fail_timeout=1s;
        server mimir-3:8080 max_fails=1 fail_timeout=1s backup;
    }

    server {
        listen 9009;
        access_log /dev/null;
        location / {
            proxy_pass http://backend;
        }
    }
}
Docker Compose – Unified Deployment
A single Compose file ties everything together, creating a complete distributed observability stack that fits into a single VM:
services:
  alloy:
    image: grafana/alloy:latest
    container_name: alloy
    restart: unless-stopped
    volumes:
      - ./config.alloy:/etc/alloy/config.alloy
      - /var/run/docker.sock:/var/run/docker.sock
      - alloy_data:/var/lib/alloy/data
    command: >
      run
      --stability.level=experimental
      --server.http.listen-addr=0.0.0.0:12345
      --storage.path=/var/lib/alloy/data
      /etc/alloy/config.alloy

  tempo:
    image: grafana/tempo:latest
    container_name: tempo
    restart: unless-stopped
    volumes:
      - ./tempo.yaml:/etc/tempo.yaml
    command: ["-config.file=/etc/tempo.yaml"]

  mimir-lb:
    image: nginx:latest
    container_name: mimir-lb
    volumes:
      - ./configs/services/mimir/nginx.conf:/etc/nginx/nginx.conf:ro
    depends_on:
      - mimir-1
      - mimir-2
      - mimir-3
    ports:
      - 9009:9009

  mimir-1:
    image: grafana/mimir:latest
    command: ["-config.file=/etc/mimir.yaml"]
    hostname: mimir-1
    volumes:
      - ./configs/services/mimir/mimir.yaml:/etc/mimir.yaml
      - ./configs/services/mimir/alertmanager-fallback-config.yaml:/etc/alertmanager-fallback-config.yaml
      - mimir-1-data:/data

  mimir-2:
    image: grafana/mimir:latest
    command: ["-config.file=/etc/mimir.yaml"]
    hostname: mimir-2
    volumes:
      - ./configs/services/mimir/mimir.yaml:/etc/mimir.yaml
      - ./configs/services/mimir/alertmanager-fallback-config.yaml:/etc/alertmanager-fallback-config.yaml
      - mimir-2-data:/data

  mimir-3:
    image: grafana/mimir:latest
    command: ["-config.file=/etc/mimir.yaml"]
    hostname: mimir-3
    volumes:
      - ./configs/services/mimir/mimir.yaml:/etc/mimir.yaml
      - ./configs/services/mimir/alertmanager-fallback-config.yaml:/etc/alertmanager-fallback-config.yaml
      - mimir-3-data:/data

  grafana:
    image: grafana/grafana
    restart: always
    volumes:
      - /var/lib/grafana:/var/lib/grafana

  loki:
    container_name: loki
    image: grafana/loki:3
    command: "-config.file=/etc/loki/config.yaml -config.expand-env=true -log.level=warn"
    volumes:
      - ./configs/loki/config.yaml:/etc/loki/config.yaml:ro
      - loki_data:/loki:rw
    environment:
      AWS_ACCESS_KEY_ID: YOUR_ACCESS_KEY
      AWS_SECRET_ACCESS_KEY: YOUR_SECRET_KEY
    restart: always

  prometheus:
    image: prom/prometheus
    restart: always
    volumes:
      - ./configs/services/monitoring/prometheus.yml:/etc/prometheus/prometheus.yml
      - /data/prometheus:/prometheus/data
    command:
      - --config.file=/etc/prometheus/prometheus.yml
      - --storage.tsdb.retention.time=7d
      - --log.format=json
      - --web.enable-admin-api
      - --enable-feature=native-histograms
      - --web.enable-remote-write-receiver

  caddy:
    image: caddy:2
    restart: always
    ports:
      - 80:80
      - 443:443
      - 443:443/udp
    volumes:
      - caddy_data:/data/caddy
      - ./configs/caddy:/etc/caddy
      - /var/www:/var/www

volumes:
  caddy_data:
  alloy_data:
  mimir-1-data:
  mimir-2-data:
  mimir-3-data:
  loki_data:
    driver: local
Caddy – The Secure Ingestion Layer
Caddy serves as the public-facing edge, handling:
- TLS termination with automatic certificate management
- PROXY protocol support for real client IPs behind load balancers
- Reverse proxying to internal services
- CORS configuration for Faro browser telemetry
- HTTP Basic Authentication for ingestion endpoints
Main Caddyfile:
{
  servers :443 {
    listener_wrappers {
      proxy_protocol {
        allow 10.0.0.0/8
        allow 172.16.0.0/12
        allow 192.168.0.0/16
        allow 203.0.113.0/24
        timeout 5s
      }
      tls
    }
    protocols h1 h2 h3
  }

  servers :80 {
    listener_wrappers {
      proxy_protocol {
        allow 10.0.0.0/8
        allow 172.16.0.0/12
        allow 192.168.0.0/16
        allow 203.0.113.0/24
        allow 167.235.107.217/32
        timeout 5s
      }
      http_redirect
    }
    protocols h1 h2c
  }

  servers :8080 {
    protocols h1 h2c
  }

  log {
    output stdout
    format json
  }
}

(cors_any) {
  header {
    Access-Control-Allow-Origin "{http.request.header.Origin}"
    Access-Control-Allow-Methods "GET, POST, PUT, PATCH, DELETE, OPTIONS"
    Access-Control-Allow-Headers "Authorization, Content-Type, X-Requested-With, x-faro-session-id"
    Access-Control-Allow-Credentials "true"
    Access-Control-Max-Age "3600"
    Vary "Origin"
  }
  @preflight method OPTIONS
  respond @preflight 204
}

https:// {
  tls internal {
    on_demand
  }

  root * /var/www/default
  file_server
}

import sites-enabled/*.conf
Site configurations:
# Expose Faro receiver with CORS
faro.example.com {
  import cors_any
  reverse_proxy /* alloy:12347
}

# Main Grafana interface
grafana.example.com {
  reverse_proxy /* grafana:3000
}

# OTLP HTTP receiver endpoint
otel.example.com {
  reverse_proxy /* alloy:4318
}

# Prometheus with authentication
prom.example.com {
  basic_auth {
    ingest $2y$12...
  }
  reverse_proxy /* prometheus:9090
}

# Loki with authentication
loki.example.com {
  basic_auth {
    ingest $2y$12...
  }
  reverse_proxy /* loki:3100
}
Frontend Observability with Grafana Faro
This stack doesn't stop at backend telemetry. Faro sends browser events, Web Vitals, errors, performance metrics, and navigation data to Alloy → Loki → Grafana.
  (function () {
    // Create a script tag for loading the library
    var script = document.createElement('script');
    script.onload = () => {
      window.GrafanaFaroWebSdk.initializeFaro({
        url: 'https://otel.example.com/collect',
        app: {
          name: 'my-frontent-app',
          version: '1.0.0',
        },
      });
    };
    script.src = 'https://unpkg.com/@grafana/faro-web-sdk@^1.19.0/dist/bundle/faro-web-sdk.iife.js';
    document.head.appendChild(script);
  })();
Faro provides:
- Core Web Vitals: LCP (Largest Contentful Paint), CLS (Cumulative Layout Shift), FID (First Input Delay), INP (Interaction to Next Paint), TTFB (Time to First Byte)
- Resource timing: DNS lookup, fetch time, transfer size, cache status
- SPA navigation events: Page transitions, route changes
- Error tracking: JavaScript exceptions with stack traces
- Session metadata: Browser, OS, viewport dimensions
- Custom events: Application-specific telemetry
The Alloy pipeline extracts low-cardinality fields as labels for efficient filtering, while keeping high-cardinality data (URLs, session IDs, user agents) as structured metadata. This design keeps Loki queries fast while preserving full context for debugging.
Final Thoughts
This setup is intentionally future-facing: a single observability pipeline you can deploy anywhere – Hetzner, your own servers, Kubernetes, or hybrid cloud environments – without reinventing the wheel each time.
What you get:
- Managed-level features without managed pricing
- Predictable costs based on storage, not ingestion volume
- Vendor neutrality with full control over data
- Deep insight into backend + frontend behavior
- A single debugging interface for all production incidents
- Production-ready architecture that scales horizontally
Everything is built on emerging industry standards (OpenTelemetry, OTLP, PromQL, LogQL) rather than proprietary agents and exporters. The components are interchangeable – swap Tempo for Jaeger, Loki for ElasticSearch – without rewriting application code.
If the cloud-native vendors are the hotel buffet of observability, this stack is the à la carte kitchen – more control, cleaner ingredients, and no surprise charges when traffic spikes or your application actually works as intended.
The total cost? A $20/month VM on Hetzner, some object storage at pennies per GB, and the satisfaction of knowing exactly where your telemetry goes and what it costs you.


Comments ()